Over a year ago I analyzed restaurant reviews in Budapest and came up with a complimentary way to rank businesses. This was based on the 4- and 2-star reviews rather than the average score. I followed up by repeating this analysis for Toronto. Below are the results (particularly comparing the two cities) and some new thoughts.
Methods
The idea is the same as in the Budapest analysis: use a Selenium-based bot to scrape a certain website for restaurants and get their star distributions. For Toronto I decided to go with Yelp rather than TripAdvisor. Since Yelp only allows you to see 33 pages for each search, even if there are more results, I had to first generate a list of all neighbourhoods in the city (71 as defined by Yelp, some seem to overlap), and then search each one. Toronto supposedly has 296 pages with 8852 results. With my method I was only able to gather 5801 results (approx. 2/3), not clear what is missing (maybe there are restaurants that fall in gaps between neighbourhoods, or Yelp doesn’t know how to associate their location to a specific neighbourhood).
Results
| Statistic | Budapest | Toronto |
|---|---|---|
| $N$ | 734 | 1634 |
| $\langle s \rangle$ | 3.92 | 3.49 |
| $\mathrm{std}(s)$ | 0.52 | 0.45 |
| $\mathrm{corr}(\bar{n}_5, s)$ | 0.92 | 0.87 |
| $\mathrm{corr}(\bar{n}_4, s)$ | 0.00 | 0.45 |
| $\mathrm{corr}(\bar{n}_3, s)$ | –0.69 | –0.53 |
| $\mathrm{corr}(\bar{n}_2, s)$ | –0.84 | –0.77 |
| $\mathrm{corr}(\bar{n}_1, s)$ | –0.91 | –0.87 |
| $s_\mathrm{pred}$ | $3.45 + 1.66 \bar{n}_5 - 3.03 \bar{n}_1$ | $3.35 + 1.90 \bar{n}_5 - 3.02 \bar{n}_1$ |
| $\mathrm{corr}(s_\mathrm{pred}, s)$ | 0.992 | 0.980 |
| $\langle \log(\bar{n}_4/\bar{n}_2) \rangle$ | 1.61 | 1.09 |
| $\mathrm{std}[\log(\bar{n}_4/\bar{n}_2)]$ | 0.74 | 0.70 |
| $\langle \bar{n}_4 - \bar{n}_3 - \frac{1}{2}\bar{n}_2 \rangle$ | 0.13 | 0.07 |
| $\mathrm{std}\left(\bar{n}_4 - \bar{n}_3 - \frac{1}{2}\bar{n}_2\right)$ | 0.10 | 0.13 |
$N$ is the number of restaurants used in the analysis. The selection condition was that each establishment should have at least three reviews in each star category, to avoid small-number statistics (this however creates a popularity bias in the analysis). $s$ is the simple average score, its mean and standard deviation are given in the table. The following five rows are the correlation coefficients of each component of the normalized histogram “vector” with the average score. $s_\mathrm{pred}$ is the linear combination of $\bar{n}_5$ and $\bar{n}_1$ that best predicts $s$, and its correlation with $s$ is given in the following row. The following two rows are related to the alternative score from the previous article, and the last two rows are the new alternative score discussed below.
Discussion
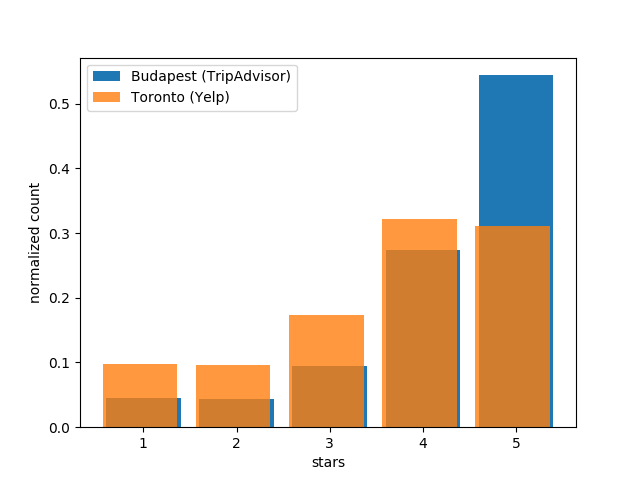
The striking difference is how generous the Budapest reviewers were with their 5-star ratings compared to Toronto, bumping the average score about half a star higher. This may be a TripAdvisor vs. Yelp thing rather than a Budapest vs. Toronto thing. This leads to the fact that the 4-star reviews are more determinative of the average score in Toronto, showing a positive (if weak) correlation rather than almost exactly zero correlation as in the Budapest case. Similarly, the average score prediction using only the 1- and 5-star reviews is slightly less accurate than in Budapest (but still really good).
This extremely high correlation between $s_\mathrm{pred}$ and $s$ in the Budapest analysis led me to using the ratio of 4- to 2-star reviews to compliment the average score. I took it to be a simple approach that ignores human psychology other than the main assumption that 5- and 1-star reviews are representative of more extreme views for better and for worse. However, looking at the ratio between the 4- and 2-star reviews implicitly assumes that these reviews are symmetric in a sense. I do think now that giving a 2-star review represents a more negative experience than a 4-star review represents a positive one. Additionally, my assumption that the 3-star reviews have no value because they are neither positive nor negative is also not likely to be correct. As in both Budapest and Toronto they are negatively correlated with the average, we should probably take it to mean that 3-star reviews represent a negative view. I came up with a new complimentary score, which somewhat compensates for the above disadvantages of the 4-to-2 ratio method. The new alternative score, which I define as
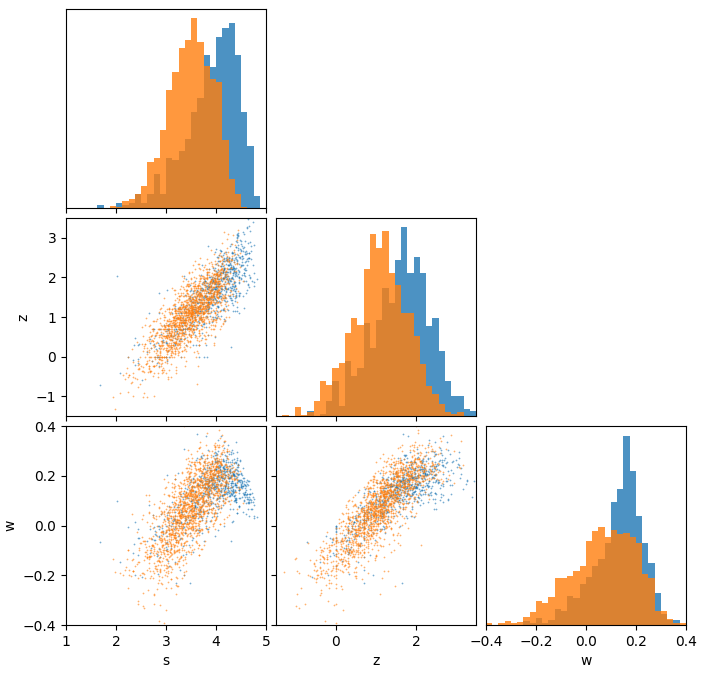
\[\begin{align*} w = \bar{n}_4 - \bar{n}_3 - \textstyle{\frac{1}{2}}\bar{n}_2 \end{align*}\]is motivated by linear algebra. The weighted mean (i.e. regular score $s$) is a dot product in $\mathbb{R}^5$ of the normalized histogram with the vector (1,2,3,4,5). The alternative score $w$ is a dot product with an orthogonal vector (0,-½,-1,1,0). Of course, there are infinitely many orthogonal vectors, the main idea here is that a 2-star review carries only half the weight as a 4-star review, but now the 4-star reviews have to balance both 2- and 3-star reviews. The orthogonality means that $s$ and $w$ are two independent projections of the histogram vector, it is essentially a separate category. While $s$ represents very decisive reviews, $w$ gives voice to the more mild ones. Clearly $w$ alone is not sufficient to identify an extraordinary restaurant – we do expect such an establishment to have a good amount of 5-star reviews.
I therefore compiled a ranked list by walking down through the sorted lists of $s$ and $w$ (contact me to receive it). I am absolutely in favour of trying out restaurants that have a low rank or were excluded from the analysis due to small-number statistics (one of my favourites was excluded because it had too few 1- and 2-star reviews), but when looking for more guarenteed satisfaction I would consult the list. This figure shows the distribution of points. Here $z\equiv\log(\bar{n}_4/\bar{n}_2)$ (this is a bit different from the previous article, where I rescaled $z$ to have a mean of zero and a standard deviation of unity).