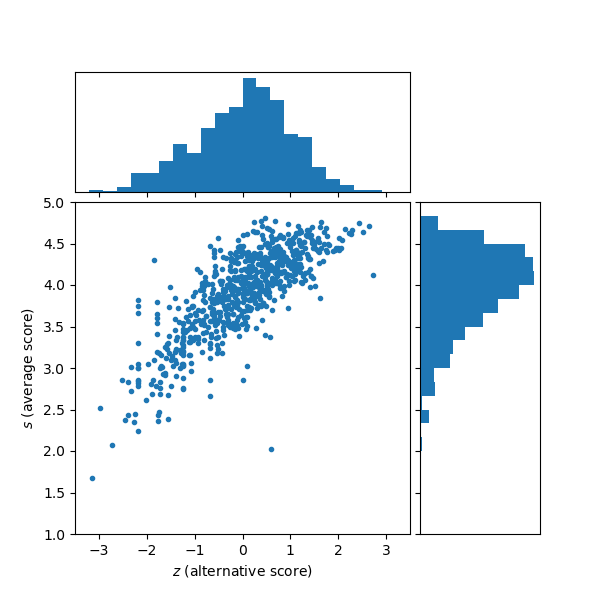
Choosing a restaurant can be a difficult task, and is often based on a single number, the score of a restaurant in an online listing. This score is usually a weighted arithmetic mean of customer’s one- to five-star reviews, such is the case with TripAdvisor. But how reliable is this number? Let’s find out. In the figure I plotted the “standard” average score versus some alternative (complementary) definition that will be discussed in this article.
As of May 2018, there are 2,669 restaurants listed on TripAdvisor in Budapest. I wrote a script (in Python using Selenium) that scrapes the review page of each of them and extracts the ratings. That is, how many reviewers gave the establishments 5 stars, 4 stars, etc. There were 2,488 restaurants with at least one review and 363,288 reviews in total; 1,960 restaurants with at least 5 reviews (their average score was 4.08); and 734 restaurant with at least 3 reviews at each star category (their average score was 3.92). I focus on this last group.
The five star system looks like a good idea to begin with. You have a middle rating of 3 stars and two satisfaction levels, (un)satisfied and extremely (un)satisfied. I’m not sure humans can reliably be trusted with more rating levels. IMDB, for example, uses a 1 to 10 stars system (5 satisfaction levels and no middle rating); the exact rating I give a movie probably depends on many random factors and may not be very reproducible.
A major problem with the 5-star system and user reviews in general is that the psychology behind each rating is different. For example, a very bad experience incentivizes one to go online and give a bad review, and a particularly good experience incentivizes one to go online and give a good review, but these incentives are not necessarily proportional to the badness/goodness of the experience in the same way. There is much less incentive to go online and give an average rating.
As noted above, the average score for restaurants in Budapest is around 4 stars, so what TripAdvisor would call “very good”, rather than “average”. So the average is above average… This could either be because restaurants in this city in particular are better than the global average, or, more likely, because the score is not calibrated in any way and people tend to give higher ratings, or otherwise because the results are manipulated by removing bad reviews (which are more likely to have profanity).
It turns out, not so surprisingly, that the fraction of 5-star and 1-star votes are enough to pretty much determine the score. The linear combination
\[\begin{align*} s_\mathrm{pred} = 3.45 + 1.66 \bar{n}_5 - 3.03 \bar{n}_1 \end{align*}\]is within ~0.06 stars from the average rating 68% of the time, and within ~0.1 stars from the average rating 90% of the time. Here, $\bar{n}_1$ and $\bar{n}_5$ are the normalized 1- and 5-star results, respectively, meaning the number of reviews divided by the total number.
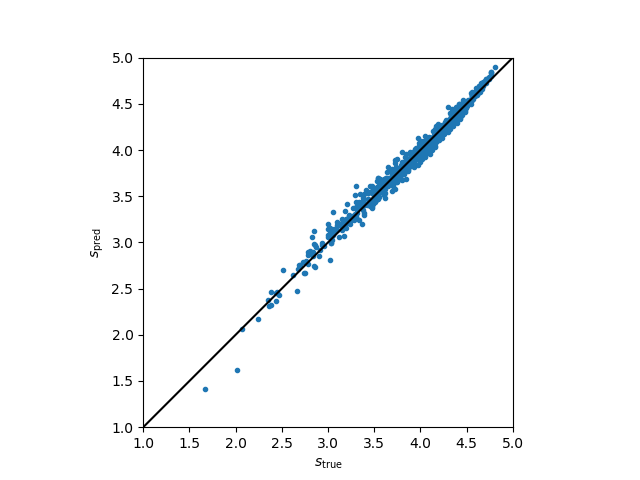
The number of 2-, 3-, and 4-star reviews comes into this calculation through the normalization; if normalizing using the sum of 1- and 5-star reviews only, there is still a tight relation with the average score, but not a very linear one. I should also note that the correlation of $\bar{n}_5$ with the score is 0.92 and the correlation of $\bar{n}_1$ with the score is –0.91, so each fraction on its own is already quite a good indicator of the average score. The linear combination above gives a correlation coefficient of 0.992. Is this to say that 2- to 4-star reviews don’t matter? Pretty much, I guess, when it comes to the average score, it’s entirely predictable from the extremal ratings. The 4-star fraction has no correlation with the average score (–0.003) while the 3- and 2-star fractions have somewhat negative correlations (–0.69 and –0.84, respectively).
Now for the speculative part: there should be some useful information in the rating histograms that is not reflected by the average – as with any distribution, one would often look to its higher moments for insight. The 1- and 5-star reviews are the outliers that basically determine the mean. One can construct infinitely many alternative estimators that reduce the importance of the outliers, correcting for psychological biases, etc. I will go with a very simple approach of completely ignoring them (since they determine the average, as stated above, it looks like all the useful information has been extracted from them). My chosen solution is to look at the ratio of 4- to 2-star reviews. My new score is this quantity:
\[\begin{align*} z \equiv 1.36\log(n_4/n_2) - 2.18 \end{align*}\]where the numerical constants are used to shift the quantity so that the mean is zero and the standard deviation is one, for my sample of 734 restaurants. The range of z is infinite, theoretically, but for this set it ranged between –3.15 and 2.72. The correlation coefficient of z with the average rating is 0.79, which is good. We expect there to be positive correlation, but if it were too strong then this would not be a theoretically useful quantity.
The winner in terms of average is a lovely Italian restaurant at the city centre which I visited once and was very satisfied with (gave a 5-star review). In terms of the alternative score, the winner is a branch of an American fast food restaurant. This is quite surprising! At the bottom of the list in terms of both average and alternative scores seems to be (according to the reviews) a tourist trap at the city centre.
The alternative score should be used as supplementary information to the standard score; I’m not saying it is the magic number that solely determines the quality of a restaurant. In the future, I will try to visit restaurants which have high z but moderate or low s.